
The Message Delivery Dashboard is built for quick access to statistics and information related to messages sent and received. This helps in keeping a track of all messages in one place with visual depictions and statistical information.
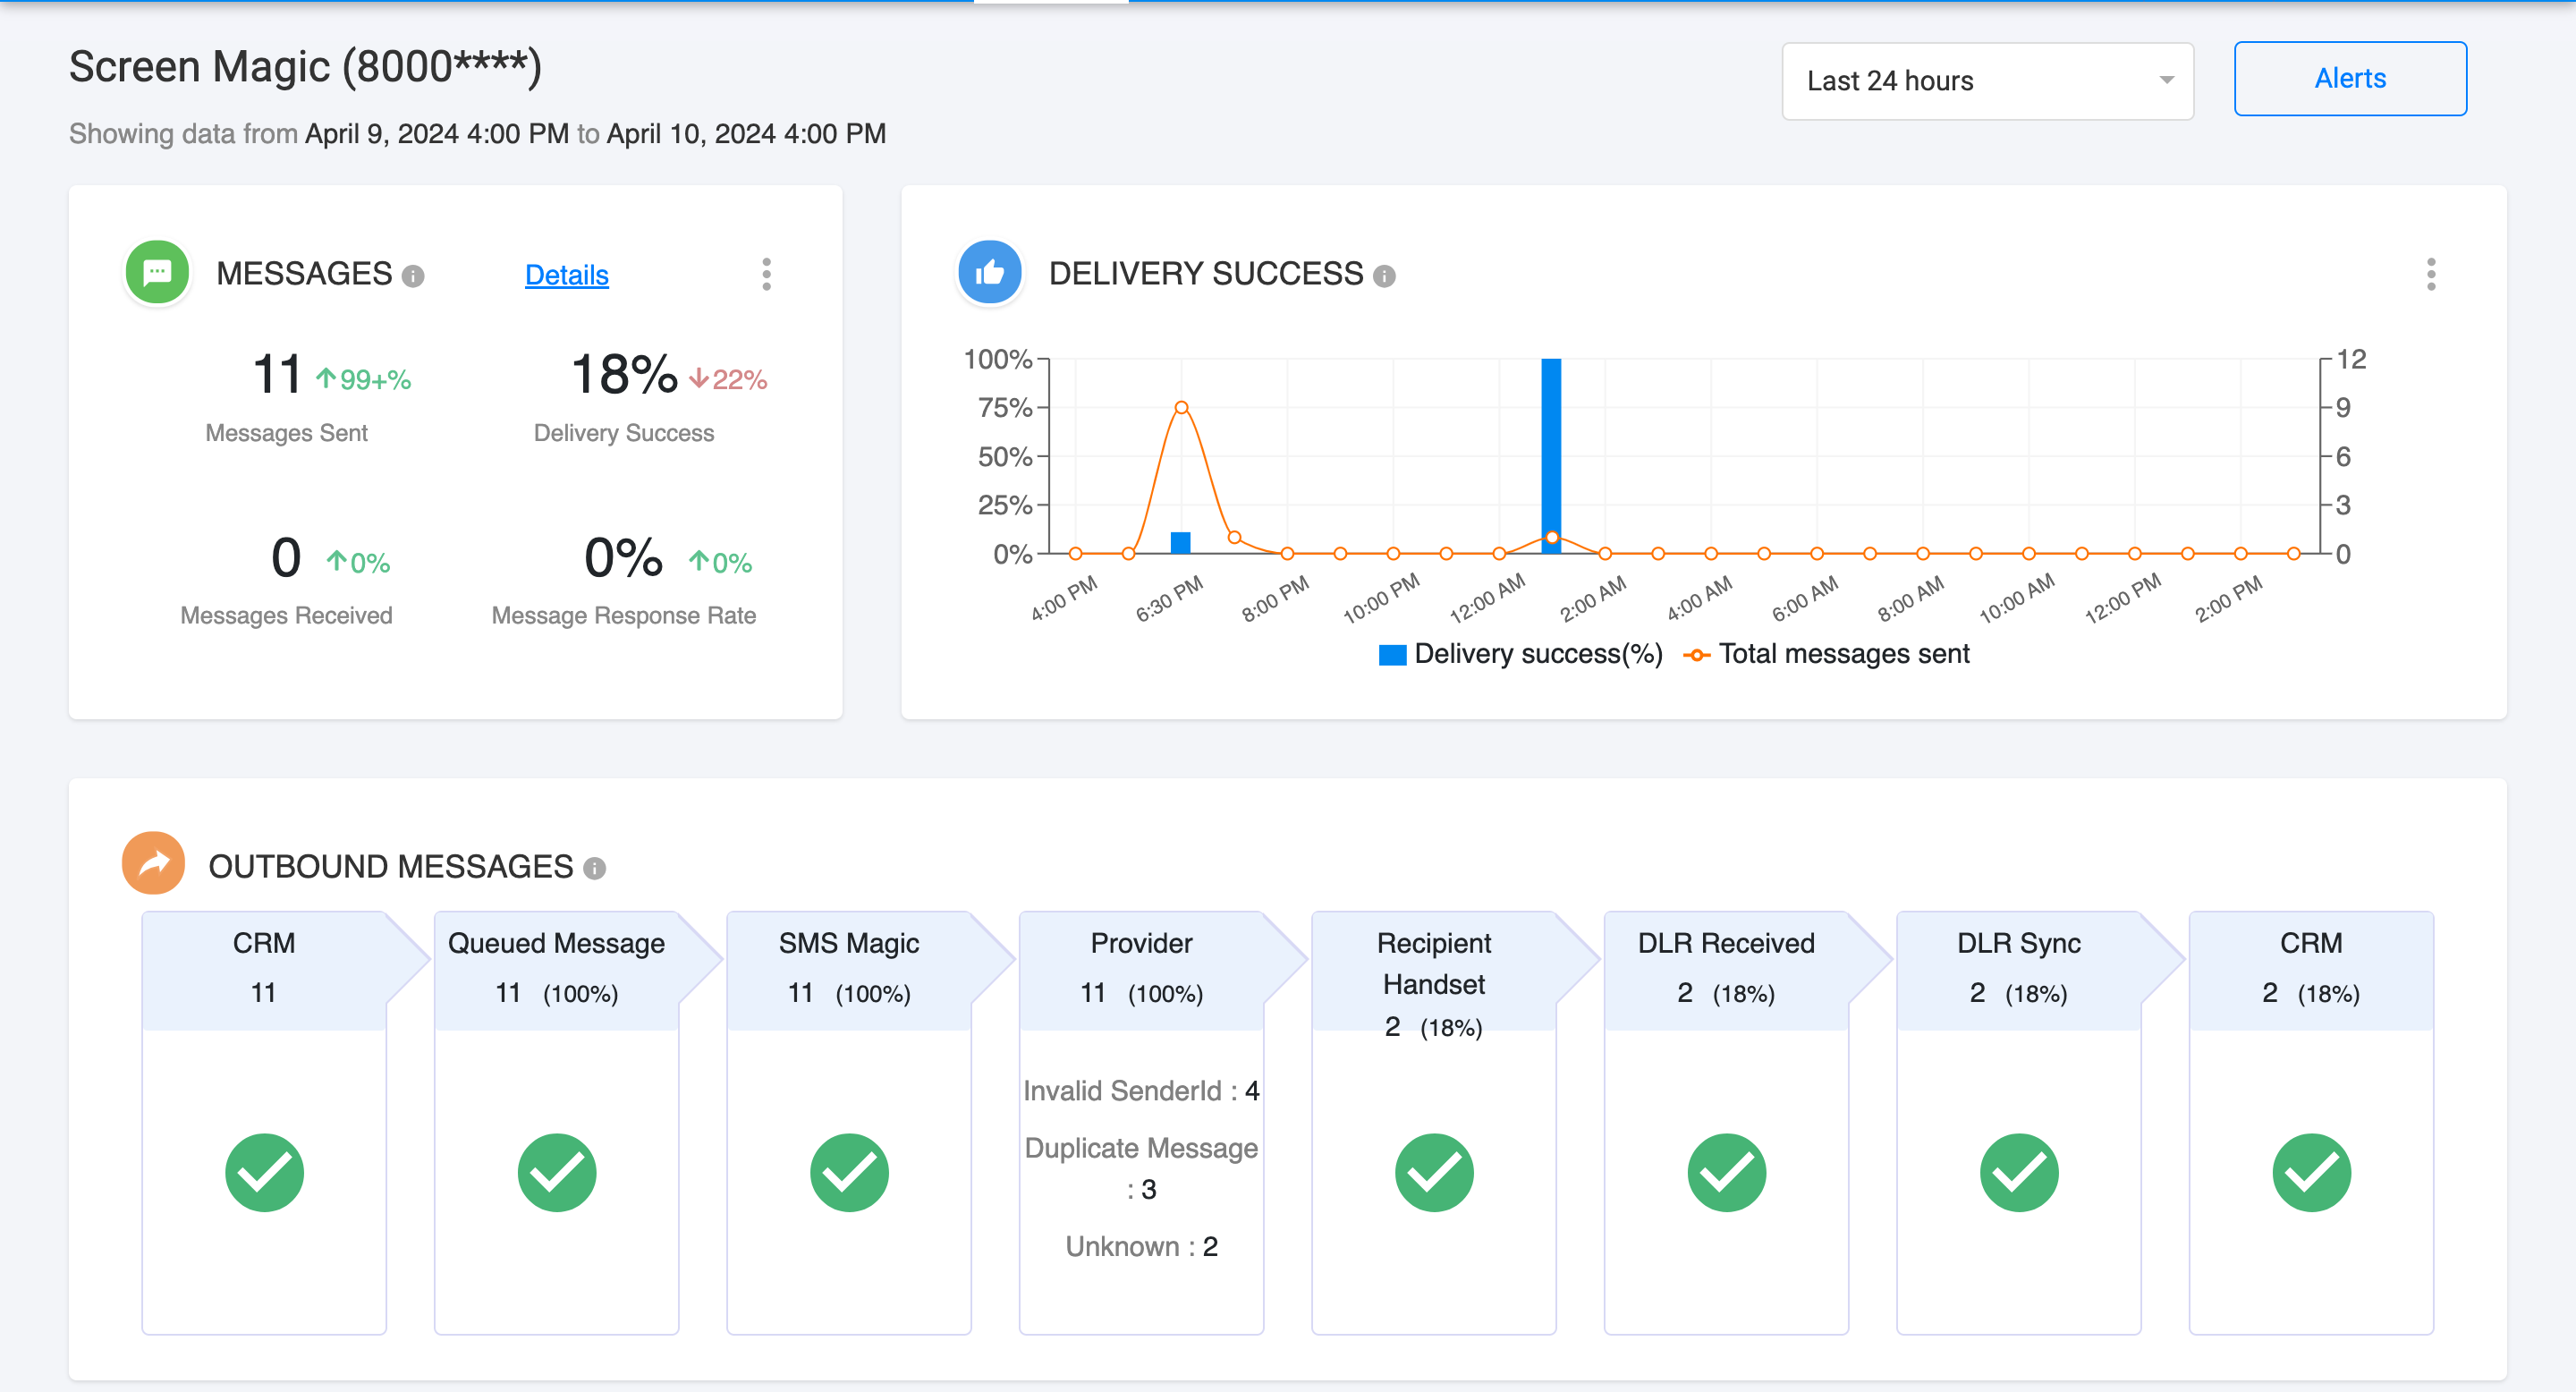
The information in the Dashboard can be filtered using the filter drop-down as shown below:
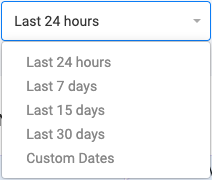
FILTER | DESCRIPTION |
Last 24 Hours | Displays hourly information for the last 24 hours |
Last 7 Days | Displays daily information of the last 7 full days |
Last 15 Days | Displays daily information of the last 15 full days |
Last 30 Days | Displays daily information of the last 30 full days |
Custom Dates | Displays information as per date range set |
There are 6 different widgets in the Dashboard:
Messages
Delivery Success
Inbound Messages
Outbound Messages
Delivery Errors
Undelivered Messages
Delivery Success
Displays graphical representation of the rate of successfully delivered messages along with the number of outgoing messages. The visual representation can be changed as per the filters and detailed information can be viewed on mouse hover as shown below.

CONDITION TYPE | DISPLAY TYPE |
24 HOURS | HOURLY |
> 4 HOURS < 96 HOURS | HOURLY |
> 96 HOURS | DAILY |
> 96 HOURS < 4 MONTHS | DAILY |
> 4 MONTHS | MONTHLY |
Inbound Messages
Displays the number of incoming messages received on the SMS Platform and synced successfully with the CRM. The values are displayed in buckets as shown below:

BUCKET TYPE | DESCRIPTION |
Messaging Platform | Total number of incoming messages received at the messaging platform. |
CRM Sync | Total number of incoming messages being processed to sync with CRM. |
CRM | Total number of incoming messages synced with CRM. |
Outbound Messages
Displays a set of information in separate buckets depicting the flow of messages from the source CRM to DLR synced with CRM. The information displayed in the buckets is related to values of successfully processed and errors occurred at every stage of message flow.
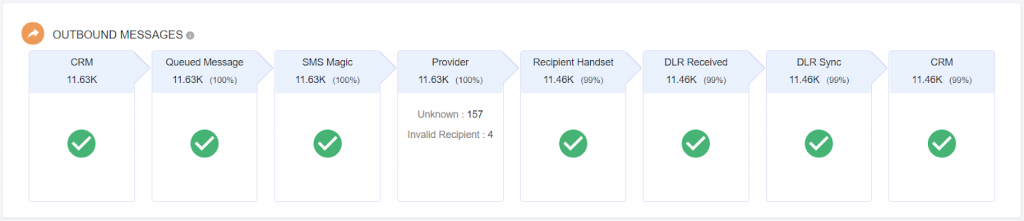
BUCKET TYPE | DESCRIPTION |
CRM | Total number of messages sent from source CRM |
Queued | The number of messages with pending processing due to business hours, office hours and rate-limiting |
Messaging Platform | Total number of messages sent to the Provider via the messaging platform. |
Provider | Total number of messages sent to recipients by Provider |
Recipient Handset | Total number of messages delivered to the end recipient. |
DLR Received | Total number of delivery reports received at messaging platform for delivered messages |
DLR Sync | Total number of delivery reports being processed to sync with CRM |
CRM | Total number of delivery reports synced with CRM |
Errors
Displays the message delivery errors only. The information is dynamically gathered from the errors that occurred in the outgoing message flow from CRM to Recipient handset and displayed in a pie chart. The details can be viewed on mouse hover as shown below:

Undelivered Messages
Displays a detailed list of undelivered messages. A more detailed review can be initiated by clicking Details.
DETAILS TYPE | DESCRIPTION |
Cause | The reason for the error occurrence. |
Remedy | The solution to avoid the error occurrence. |

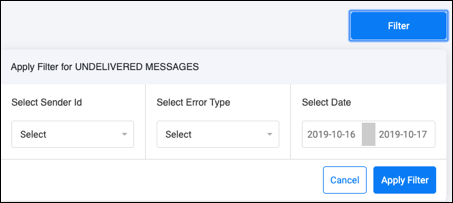
Filtering Table Data for Undelivered Messages
Click on the Filter button
Select the Sender ID as per requirements
Select the Error Type as per requirements
Select the Date range as per requirements
Click on the Apply Filter button
Alerts
This section displays the total number of alerts and details related to alerts. This section is useful in keeping a track of all the past alerts and view details in one go.
This section has been divided into 4 widgets:
Alerts Sent
Active Rules
Maximum Alerts and Maximum Alerts generated from Alerts
Alert History
Alerts Sent
Displays the total number of Alerts sent in 30 days.

Active Rules
Displays the total number of Active Rules for the Dashboard.

Maximum Alerts and Maximum Alerts generated from Alert
Displays the maximum number of Alerts Generated from the Alerts. The widget also displays the highest generated Alerts.

Alert History
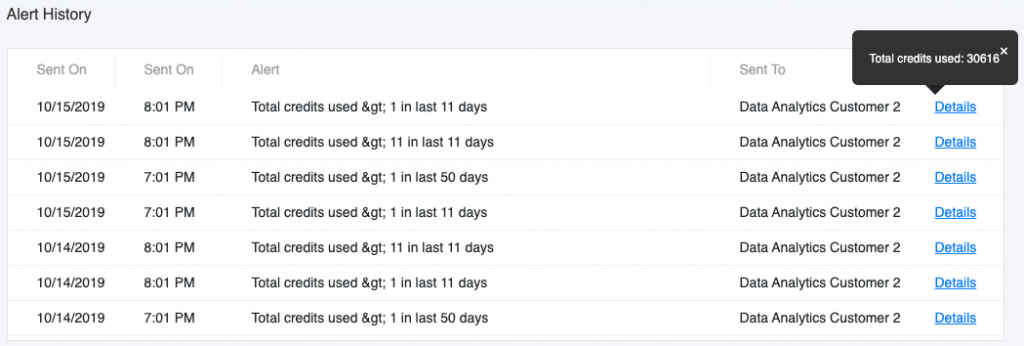
Displays all the alerts generated in the past. Click on the Details button to view the value/rate generated via the specific Alert as shown below:
Filtering Table Data for Alert History
1. Click on the Filter button
2. Select the Date range as per requirements
3. Select the Alert Rules as per requirements
4. Click on the Apply Filter button

